It’s the first time for me to learn what service mesh is, how it works, and how to start the lab to deep dive on this stuff. In this article, there will be some of my notes about how to install Istio and see the visualization of some microservices that will have been monitored by Istio and I’m going to write it up now.
As usual, it would be better if we have good comprehension on what we’re going to learn.
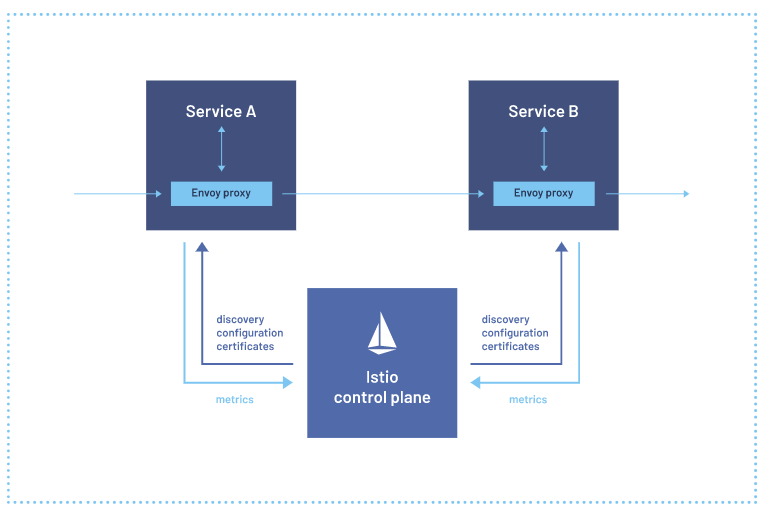
A service mesh is a dedicated infrastructure layer that you can add to your applications. It allows you to transparently add capabilities like observability, traffic management, and security, without adding them to your own code
source: https://istio.io/latest/about/service-mesh/*
Based on the explanation above, we should have known what service mesh is. I’m going to conclude it simpler : “Service mesh is a way to ease our life in order to manage microservice apps with its complexity of growth” (I hope I don’t get it wrong hahaha)
So let’s have some practices right away!
- Download Istio Release
We can download it either from the latest version or certain version we want to install. I assume we use linux for this labs, here I use minikube that is running on Centos 7. Honestly when I was deploying the manifest I experienced some issues that made me confused quite a bit for hours.( it might be I use minikube for this labs but not for sure ). Anyway, after doing some tshoots, gotcha!! I can move on to the other part of this lab. Just ranting anyway 😀
Download the latest version :
curl -L <a href="https://istio.io/downloadIstio">https://istio.io/downloadIstio</a> | sh -
Or we can download another version as well :
curl -L https://istio.io/downloadIstio | ISTIO_VERSION=[VERSION] TARGET_ARCH=[CPU_ARCH] sh -
Since I do the labs and write this article, I use Istio v1.9.0 , it might be some different steps but however it should the same in general.
- Copy istioctl binary file into system path
cp ~/istio-1.9.0/bin/istioctl /usr/local/bin
Then, we can also do this way:
export PATH=$PWD/bin:$PATH
- Install Istio Core, Istiod, Ingress Gateway
These 3 things are components that will run as control plane. I’ll try to separate about istio components in other occasion ( I’ve to learn more first hahaha)
istioctl install

output :
✔ Istio core installed
✔ Istiod installed
✔ Ingress gateways installed
✔ Installation complete
As simple as that 🙂
Then, 2 pods of istio should be appeared on istio-system namespace :
kubectl get pods -n istio-system

output :

NAME                                    READY   STATUS    RESTARTS   AGE
istio-ingressgateway-66644ff9c8-nngfb   1/1     Running   0          13s istiod-866c5d9599-wz6k5                 1/1     Running   0          13s
- Deploy microservice apps
For this labs, I cloned kubernetes manifest of microservice apps from https://github.com/GoogleCloudPlatform/microservices-demo
git clone <a href="https://github.com/GoogleCloudPlatform/microservices-demo">https://github.com/GoogleCloudPlatform/microservices-demo
Then, go to the release directory
cd microservices-demo/release && lsoutput :istio-manifests.yaml kubernetes-manifests.yaml
Apply the manifest
kubectl apply -f kubernetes-manifest.yaml

output:

deployment.apps/emailservice created
service/emailservice created
deployment.apps/checkoutservice created
service/checkoutservice created
deployment.apps/recommendationservice created
service/recommendationservice created
deployment.apps/frontend created
service/frontend created
service/frontend-external created
deployment.apps/paymentservice created
service/paymentservice created
deployment.apps/productcatalogservice created
service/productcatalogservice created
deployment.apps/cartservice created
service/cartservice created
deployment.apps/loadgenerator created
deployment.apps/currencyservice created
service/currencyservice created
deployment.apps/shippingservice created
service/shippingservice created
deployment.apps/redis-cart created
service/redis-cart created
deployment.apps/adservice created
service/adservice created
Check those pods (it took about 2 minutes for pods to run in my machine)
kubectl get pods

output :

NAME                                     READY   STATUS             RESTARTS   AGE
cartservice-75d66997cf-2f7bq             1/1     Running            1          2m22s
currencyservice-5b74f955c4-5jfcv         1/1     Running            0          2m21s
frontend-79c8999fb6-cnkk6                1/1     Running            0          2m22s
paymentservice-7d679d5b98-wkgsz          1/1     Running            0          2m22s
recommendationservice-7569586f96-ndslt   1/1     Running            4          2m22s
shippingservice-749b654bb4-7d9l7         1/1     Running            0          2m21s
adservice-75f6d84ddd-bbxzk               1/1     Running            0          2m21s
checkoutservice-855cd595b4-f8mrr         1/1     Running            0          2m22s
emailservice-95cc959f8-thrdz             1/1     Running            0          2m22s
loadgenerator-589648f87f-pvtfn           1/1     Running            0          2m22s
productcatalogservice-5f7d6665c6-2gpm7   1/1     Running            0          2m22s
redis-cart-5b569cd47-8bwhs               1/1     Running            0          2m21s
- Inject sidecar container to each pods
Look back on the output of “kubectl get pods” above, notice that only one container running of one desired container on each pods. It means, there is no container except the microservice itself. In this step, we will inject all of them a sidecar container named “envoy proxy” on each pods. Here is the way:
- Inject a label istio-injection=enabled on its namespace. In this case, I use default namespace to deploy the apps.
kubectl label namespace default istio-injection=enabled
Then check the pods status:
kubectl get pods

output:

NAME                                     READY   STATUS             RESTARTS   AGE
adservice-75f6d84ddd-bbxzk               1/1     Running            0          5m21s
cartservice-75d66997cf-2f7bq             1/1     Running            1          5m22s
checkoutservice-855cd595b4-f8mrr         1/1     Running            0          5m22s
currencyservice-5b74f955c4-5jfcv         1/1     Running            0          5m21s
emailservice-95cc959f8-thrdz             1/1     Running            0          5m22s
frontend-79c8999fb6-cnkk6                1/1     Running            0          5m22s
loadgenerator-589648f87f-pvtfn           1/1     Running            0          5m22s
paymentservice-7d679d5b98-wkgsz          1/1     Running            0          5m22s
productcatalogservice-5f7d6665c6-2gpm7   1/1     Running            0          5m22s
recommendationservice-7569586f96-ndslt   1/1     Running            4          5m22s
redis-cart-5b569cd47-8bwhs               1/1     Running            0          5m21s
shippingservice-749b654bb4-7d9l7         1/1     Running            0          5m21s
Nothing has changed, hasn’t it? It’s normal because restarting the pods is necessary to apply the latest configuration. We can delete the pods one by one but it will take more times, however we can delete all of the resources (deployment, pods, service, etc) only by using a single way:
kubectl delete -f kubernetes-manifest.yaml
Wait until all of them is completely deleted. Then, redeploy:
kubectl apply -f kubernetes-manifest.yaml
Shortly afterwards, it will show a bunch of pods starting to initialize and run as well. Wait until all of them on running status.
kubectl get pods

output:

NAME                                     READY   STATUS    RESTARTS   AGE
adservice-75f6d84ddd-9jkv8               2/2     Running   0          19m cartservice-75d66997cf-jg8qc             2/2     Running   5          19m
checkoutservice-855cd595b4-94969         2/2     Running   0          19m currencyservice-5b74f955c4-77z7m         2/2     Running   0          19m
emailservice-95cc959f8-jp59c             2/2     Running   0          19m frontend-79c8999fb6-nkfqd                2/2     Running   0          19m
loadgenerator-589648f87f-47kf4           2/2     Running   0          19m paymentservice-7d679d5b98-dswl4          2/2     Running   0          19m
productcatalogservice-5f7d6665c6-5dlpc   2/2     Running   0          19m recommendationservice-7569586f96-fzfpj   2/2     Running   0          19m
redis-cart-5b569cd47-vq7qc               2/2     Running   0          19m shippingservice-749b654bb4-6xczm         2/2     Running   0          19m
As we look at the output above, there are 2 containers running in each pods. 1 container is the microservice itself and 1 container is envoy proxy.
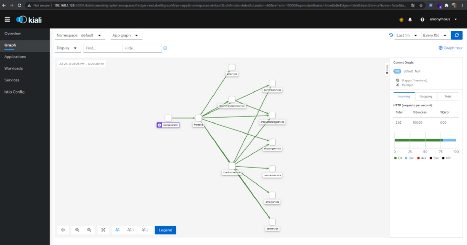
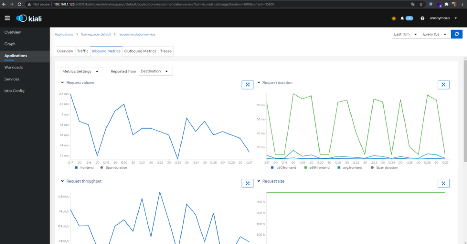
Right here, we have done all of the steps to get istio involved on our microservice apps. But now, is it finished? Definitely not. Precisely it’s the most interesting part (for me) to make istio visualized. When it comes to visualizing our service mesh into interesting graph and mapping, Kiali comes into play.

For additional information, we can configure istio to integrate with some other tools which has certain functionality that might be fit our needs. In this case I deploy all of the tools but only focus on Kiali.
It’s time to deploy Kiali ! Before that, let’s check the existing pods that run on istio-system namespace!
kubectl get pods -n istio-system

output:

NAME                                    READY   STATUS    RESTARTS   AGE
istio-ingressgateway-66644ff9c8-nngfb   1/1     Running   0          1h
istiod-866c5d9599-wz6k5                 1/1     Running   0          1h
There are only 2 pods running.
kubectl apply -f istio-1.9.0/samples/addons/

output:

serviceaccount/grafana created
configmap/grafana created
service/grafana created
deployment.apps/grafana configured
configmap/istio-grafana-dashboards configured
configmap/istio-services-grafana-dashboards configured
deployment.apps/jaeger created
service/tracing created
service/zipkin created
service/jaeger-collector created
Warning: apiextensions.k8s.io/v1beta1 CustomResourceDefinition is deprecated in v1.16+, unavailable in v1.22+; use apiextensions.k8s.io/v1 CustomResourceDefinition
customresourcedefinition.apiextensions.k8s.io/monitoringdashboards.monitoring.kiali.io created
serviceaccount/kiali created
configmap/kiali created
clusterrole.rbac.authorization.k8s.io/kiali-viewer created
clusterrole.rbac.authorization.k8s.io/kiali created
clusterrolebinding.rbac.authorization.k8s.io/kiali created
role.rbac.authorization.k8s.io/kiali-controlplane created
rolebinding.rbac.authorization.k8s.io/kiali-controlplane created
service/kiali created
deployment.apps/kiali created
monitoringdashboard.monitoring.kiali.io/envoy created
monitoringdashboard.monitoring.kiali.io/go created
monitoringdashboard.monitoring.kiali.io/kiali created
monitoringdashboard.monitoring.kiali.io/micrometer-1.0.6-jvm-pool created
monitoringdashboard.monitoring.kiali.io/micrometer-1.0.6-jvm created
monitoringdashboard.monitoring.kiali.io/micrometer-1.1-jvm created
monitoringdashboard.monitoring.kiali.io/microprofile-1.1 created
monitoringdashboard.monitoring.kiali.io/microprofile-x.y created
monitoringdashboard.monitoring.kiali.io/nodejs created
monitoringdashboard.monitoring.kiali.io/quarkus created
monitoringdashboard.monitoring.kiali.io/springboot-jvm-pool created
monitoringdashboard.monitoring.kiali.io/springboot-jvm created
monitoringdashboard.monitoring.kiali.io/springboot-tomcat created
monitoringdashboard.monitoring.kiali.io/thorntail created
monitoringdashboard.monitoring.kiali.io/tomcat created
monitoringdashboard.monitoring.kiali.io/vertx-client created
monitoringdashboard.monitoring.kiali.io/vertx-eventbus created
monitoringdashboard.monitoring.kiali.io/vertx-jvm created
monitoringdashboard.monitoring.kiali.io/vertx-pool created
monitoringdashboard.monitoring.kiali.io/vertx-server created
serviceaccount/prometheus created
configmap/prometheus created
clusterrole.rbac.authorization.k8s.io/prometheus created
clusterrolebinding.rbac.authorization.k8s.io/prometheus created
service/prometheus created
deployment.apps/prometheus created
Afterwards, let’s check the pods running on istio-system:
kubectl get pods -n istio-system

output:

NAME                                    READY   STATUS    RESTARTS   AGE
grafana-7bdcf77687-lnwfg                1/1     Running   0          100s
istio-ingressgateway-66644ff9c8-nngfb   1/1     Running   0          10h
istiod-866c5d9599-wz6k5                 1/1     Running   0          10h
jaeger-5c7c5c8d87-bwxkg                 1/1     Running   0          100s
kiali-84db5dd45-j97qf                   1/1     Running   0          99s
prometheus-f5f544b59-2bndk              2/2     Running   0          99s
Finally! We are on the last part of this labs now. Let’s access Kiali dashboard right away!
For information, I run this machine on proxmox and not directly on my own laptop, so giving the address parameter is necessary to make it accessible from the inbound traffic because the default value of address paramater is localhost.
istioctl dashboard <strong>--address=0.0.0.0</strong> --browser=false kialioutput :skipping opening a browser
Anyway we have an alternative way to access Kiali only by using port-forward provided by kubectl as well.
kubectl port-forward --address=0.0.0.0 service/kiali -n istio-system 20001
Move to browser to access the Kiali dashboard. If it works, it will appear like this picture below:


If this display doesn’t appear, it might be firewall block the traffic or any other possibilities but the common root cause is on firewall. So make sure we have allowed the inbound and outbound traffic which fits our needs or if it is only for learning purposes, stop and disable firewall is better.
Anyway that’s all I can convey a bit about this topic. I hope it will help us to understand service mesh and how to start the labs as well. If there is any mistakes from me or even have some topics to discuss about, I’m so pleased to know it 🙂 Thank you!